Psychrometric Chart PDF Free Download (SI & IP Units, High Resolution)
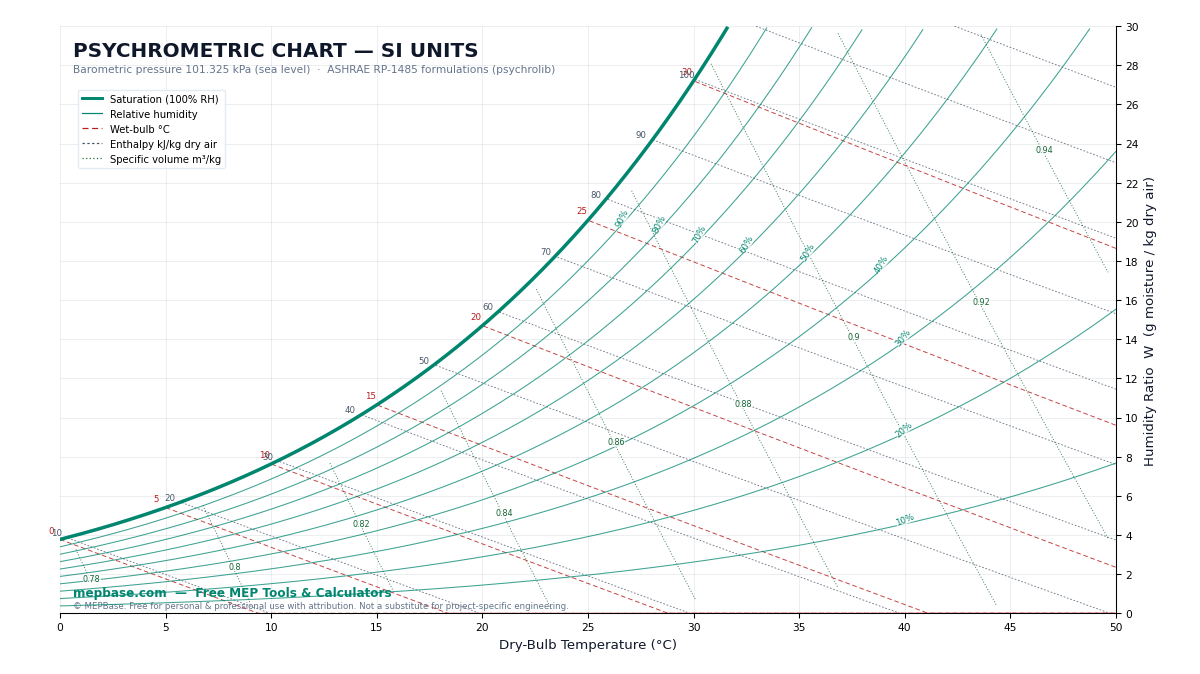
A psychrometric chart is the single most useful reference in HVAC engineering — one chart shows every property of moist air: dry-bulb temperature, humidity ratio, relative humidity, wet-bulb temperature, dew point, enthalpy and specific volume. Below you can download our free, high-resolution psychrometric chart PDF — printable at A3, in both SI and IP units.
Psychrometric Chart PDF — Free Download
This is an original MEPBase chart, computed from the ASHRAE RP-1485 psychrometric formulations (the same equations behind professional HVAC software) — so it’s accurate, and free for personal and professional use.
- Page 1 — SI units: 0–50°C dry-bulb, 0–30 g/kg humidity ratio, 101.325 kPa (sea level)
- Page 2 — IP units: 32–120°F dry-bulb, 0–210 grains/lb, 14.696 psia (sea level)
- Lines included: saturation (100% RH), RH curves 10–90%, wet-bulb, enthalpy, specific volume
- Vector PDF — stays sharp at any print size (A3 recommended)
📥 Download Psychrometric Chart PDF (SI + IP, Free)
How to Read a Psychrometric Chart (Step by Step)
Every point on the chart is one air condition. You only need two properties to fix the point — then read all the others:
- Find the dry-bulb temperature on the bottom axis and move straight up.
- Find the second known property — the RH curve, the wet-bulb line, or the humidity ratio on the right axis — and mark where the two lines cross.
- Read everything else at that point: follow the wet-bulb line up-left to the saturation curve for WB; move horizontally left to the saturation curve for dew point; read enthalpy along the diagonal scale; read humidity ratio horizontally on the right axis.
Worked Example — 25°C, 50% RH (Typical Room Air)
Mark the point where the 25°C vertical line crosses the 50% RH curve, then read:
| Property | Value | How to read it |
|---|---|---|
| Humidity ratio (W) | 9.9 g/kg | Horizontal → right axis |
| Wet-bulb temperature | 17.9 °C | Along WB line → saturation curve |
| Dew point | 13.9 °C | Horizontal left → saturation curve |
| Enthalpy (h) | 50.3 kJ/kg | Diagonal enthalpy line |
| Specific volume (v) | 0.858 m³/kg | Interpolate between volume lines |
Try it on the downloaded chart — the point sits exactly on these values.
What Each Line on the Chart Means
- Dry-bulb temperature (vertical lines): what a normal thermometer reads — the bottom axis.
- Humidity ratio, W (horizontal lines): grams of water vapour per kg of dry air — the right axis. Constant during sensible heating/cooling.
- Relative humidity (curved lines): how “full” the air is with moisture compared to saturation at that temperature. The topmost curve is 100% RH — the saturation line.
- Wet-bulb temperature (diagonal dashed): the reading of a wetted thermometer — follows lines of nearly constant enthalpy. Two air streams mixing or evaporative cooling move along these lines.
- Enthalpy (diagonal): total heat content of the air — the number your cooling coil load actually depends on (Q = ṁ × Δh).
- Specific volume (steep dotted): m³ of moist air per kg of dry air — needed to convert between airflow (m³/s or CFM) and mass flow.
Common HVAC Uses of the Psychrometric Chart
- Cooling coil process: plot entering air (e.g. 26°C/55%) and leaving air (e.g. 12°C/95%) — Δh between the points × mass flow = coil load, split into sensible + latent.
- Mixing of air streams: return air + fresh air mix on the straight line between the two points, positioned by the flow ratio.
- Condensation check: if any surface is below the air’s dew point (13.9°C in our example), it will sweat — the reason chilled-water pipe insulation exists.
- Sensible Heat Ratio (SHR): the slope of the room process line — sets your supply air condition and CFM. For the quick airflow rule of thumb, see our TR to CFM Calculator (1 TR ≈ 400 CFM), and size the ducts with the Online Ductulator.
- Software cross-check: load programs like Carrier HAP generate psychrometric reports — the chart is how you sanity-check them by hand.
Quick Reference — Typical Air Conditions (Sea Level)
| Condition | DB / RH | W (g/kg) | h (kJ/kg) |
|---|---|---|---|
| Comfort design (office) | 24°C / 50% | 9.3 | 47.8 |
| Typical room return | 25°C / 50% | 9.9 | 50.3 |
| Supply air off coil | 12°C / 95% | 8.3 | 33.0 |
| Hot-humid outdoor (Gulf) | 46°C / 30% | 19.2 | 95.9 |
| Hot-dry outdoor | 45°C / 10% | 5.9 | 60.6 |
FAQ — Psychrometric Chart
What is a psychrometric chart?
A graphical map of moist-air properties: any air condition is one point, fixed by two known properties (like dry-bulb and RH), from which all others — wet-bulb, dew point, humidity ratio, enthalpy and specific volume — can be read directly.
Is this psychrometric chart PDF really free?
Yes. It’s an original MEPBase chart computed from the ASHRAE RP-1485 formulations — not a scan of ASHRAE’s copyrighted chart — so it’s legal to download, print and use freely for personal and professional work.
What pressure/altitude is the chart valid for?
Sea level (101.325 kPa / 14.696 psia). At higher altitudes air properties shift — above roughly 300–500 m, use an altitude-corrected chart or psychrometric software for precise work.
How do you read wet-bulb temperature on the chart?
From your air point, follow the diagonal wet-bulb line up and to the left until it meets the saturation (100% RH) curve — the temperature at that intersection is the wet-bulb.
What’s the difference between the SI and IP pages?
Page 1 (SI) uses °C, g/kg and kJ/kg at 101.325 kPa; Page 2 (IP) uses °F, grains/lb and Btu/lb at 14.696 psia. Same physics, same formulations — pick the unit system your project uses.
Final Thoughts
Print the A3 chart, pin it above your desk, and practice the 25°C/50% example until reading it is second nature — it’s the fastest way to sanity-check any HVAC calculation. For more free HVAC downloads, tools and calculators, stay tuned with MEPBase.com.